My Forex Trading Journey, 2013–2026: News Trading, Hard Losses and Building ToxicTraders
I started trading economic news in 2013 with a $100 MT4 account. This is the honest story of the profits, broker failures, risk mistakes and October 2024 losses that eventually led me to build ToxicTraders.

I began trading forex news in 2013. What attracted me was not the promise of easy money. It was the logic of the strategy: an economic number is released at a known time, the result differs from expectations, and the market reacts. I could see a cause, a time and a measurable response.
That clarity fascinated me. It still does.
The path that followed was not a smooth equity curve. It included early profits, weak broker due diligence, oversized positions, spread-driven stop-outs, years of active broker testing, a detour into latency arbitrage and the two losses in October 2024 that forced me to rebuild my entire approach. It also led to ToxicTraders, a platform I had imagined in different forms since 2014.
This is my account of that journey. The numbers and broker cases below describe my own experience under the conditions that existed at the time. They are not promises of future performance or claims about how any firm operates today.
Evidence note: No screenshots or statements from 2013–2014 have survived, so the early chapters are explicitly presented as my personal recollection. For the later chapters, I use anonymized closed-order records retained in ToxicTraders PostgreSQL and market ticks stored in ClickHouse. The charts below omit account logins and ticket IDs.
2013: stop orders, an auto-clicker and my first $100 account
A friend introduced me to a teacher who demonstrated news trading with pending stop orders. The idea was to place orders around the current price before a scheduled release and let the market activate one side when the number produced a strong move.
Within about a month, my friend found the first automated trading clicker we used. Once I saw an automated tool react to the release, I never returned to placing stop orders manually. The ability to connect economic data with automated execution opened an entirely new field for me to study.
One of the first complete news services I used was FXNewsKiller, a product known in the CIS market. It later stopped operating around 2020, but at that time it gave me a practical entry point into automated news trading.
My first broker was TurboForex, which no longer operates. I traded MetaTrader 4 with an initial deposit of $100. Using the auto-click system, I made approximately $300 in cumulative profit during the first two months.
For a beginner, that result was powerful. It also created a dangerous temptation: to believe that the execution environment would always remain favorable and that larger size was the fastest route forward.
Spring 2014: one release, an early breakthrough and two very different failures
By spring 2014, I had several active accounts across brokers including FXPro, Alpari, 24FX and Tickmill. A US employment release — the Total Nonfarm Payrolls number — produced a strong signal.
At FXPro, one trade increased the account balance by roughly 200% in the moment. The importance of the result was not the percentage itself. It was the first time I saw the complete idea work in practice: scheduled data, a strong deviation, fast execution and a successful withdrawal of the resulting profit.
The same period gave me two critical lessons.
I had opened an account with 24FX after finding the company through a search and assuming that its presentation looked authoritative. I had not completed serious due diligence. My trading produced a profit, but when I attempted to withdraw, the profit was cancelled and access to the original deposit was blocked. That is my recollection of the account and the reason broker verification became a permanent part of my process.
The second mistake was pure risk management. At Alpari, spreads expanded sharply during the release. I had used approximately one standard lot against a balance of about $400. The position was stopped out almost immediately.
One broker result covered the financial damage, but that did not make the decisions correct. I had learned two things that should have been obvious:
- A trading strategy cannot protect you from weak broker selection.
- A valid signal cannot protect an account from oversized exposure and extreme spread expansion.
2013–2015: the apprenticeship
I do not describe these years as a major commercial success. They were an apprenticeship.
I learned how to choose a broker more carefully, how lot size changes the entire risk profile of a news trade, and why the instrument matters. I began to understand that news trading is not only a prediction problem. It is an execution problem involving the data source, software, network, broker, liquidity environment, spread, fill speed and trade management logic.
The mistakes were expensive relative to my capital, but they were foundational. They made broker behavior and execution quality as important to me as the signal itself.
2016–2019: positive development and the realities of broker execution
From 2016 through 2019, my results and understanding developed more consistently. I expanded the range of brokers I tested and learned to adapt to very different execution environments.
Slippage receives most of the attention in discussions about news trading, but it is not always the most damaging variable. In my experience, a strategy can retain a stable win rate even with substantial slippage if fills remain consistent enough to model.
Unstable execution speed is harder. When an order can take one second or more to execute, it becomes difficult to predict where the position will open, when a trailing stop can begin working and how much of the initial impulse remains available.
Extreme spread expansion can be even more dangerous. A spread that increases five times or more can turn large position sizing into an immediate account-level risk. These conditions are difficult to know in advance. A broker must be tested under the actual releases and instruments you intend to trade.
I also encountered accounts where execution changed after the first successful news orders. At the time, I interpreted some of this behavior as dealer-side execution controls similar to what traders often call a virtual dealer. Whatever the exact mechanism, the practical lesson was the same: initial performance is not enough. Execution must be monitored over time.
What the platform actually captured in 2026
The execution database contains 3,481 news-order metric rows for my accounts between May 7 and August 14, 2026. Of those, 2,438 are recorded as filled and 814 as rejected; the remaining rows have another or incomplete result state.
Across the filled rows, recorded open latency was 177.5 ms at the median, 769.3 ms at the 90th percentile and 6,594.9 ms at the 99th percentile. The OpenSlippagePts field was present on all 2,438 filled rows, with a median of 0, a 90th percentile of 161.3 and a 99th percentile of 1,000 recorded points. Open spread was present on 2,430 filled rows.
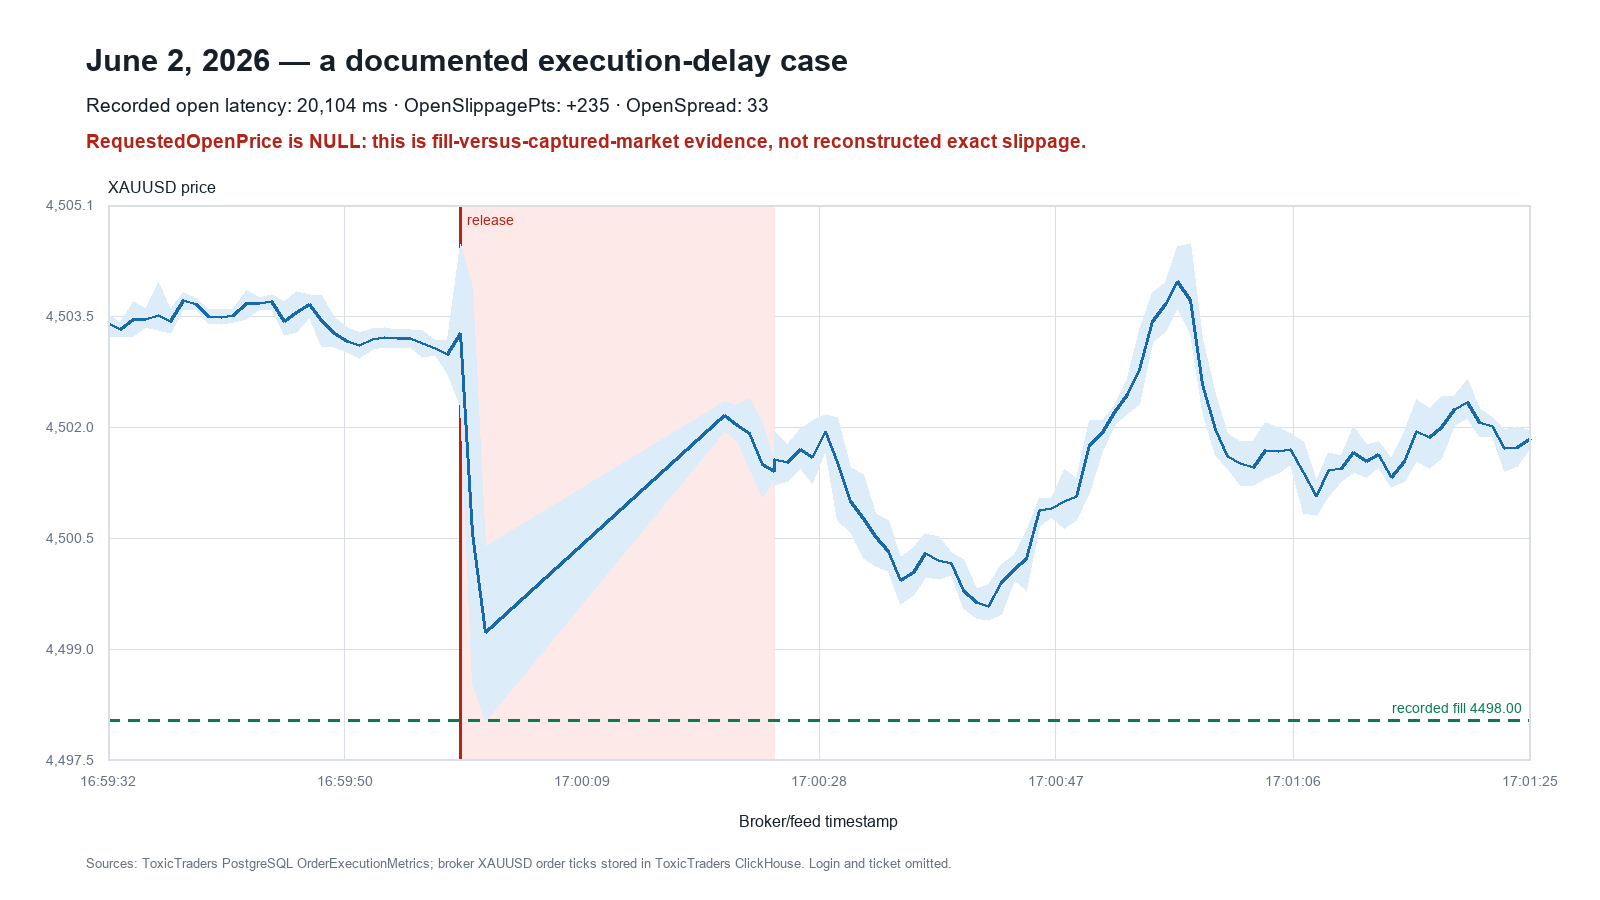
There is an important limitation: RequestedOpenPrice is absent from every metric row in this period. I therefore do not present OpenSlippagePts, or the difference between a recorded fill and a nearby market tick, as independently reconstructed exact slippage. They are execution telemetry recorded by the platform and must be read in that context.
The June 2 case below is a concrete example. PostgreSQL records a filled XAUUSD order with 20,104 ms open latency, OpenSlippagePts = 235, OpenSpread = 33 and a 4498.00 filled price. ClickHouse contains the broker tick capture around the same order. Because the timestamps use different recorded domains — server UTC for the execution metric and broker/feed time for this tick stream — the chart labels the latter explicitly.
2020–2022: when news services disappeared and I moved into latency arbitrage
The period from 2020 to 2022 was difficult. Several news-data and trading services closed, and confidence in the strategy declined. Many traders were focused on a narrow group of instruments: USDJPY and EURUSD for US releases, and AUDUSD for Australian data. I was thinking within the same limits and eventually paused active news trading.
I moved into latency arbitrage and achieved some success, but I found the model fundamentally less sustainable.
The strategy exploited a short-lived price difference between a faster reference feed and a slower broker quote. Its technical simplicity could make it extremely effective, but the operational reality was difficult. Accounts often had a short useful life, withdrawals could become disputes, and some setups relied on other people opening accounts — a model I consider fragile and unsuitable as a foundation for a serious long-term business.
This is not an arbitrage tutorial. I may write a separate article about the period, including why the strategy can work and why I ultimately consider it inferior to well-controlled news trading.
My personal conclusion was clear: even brokers that aggressively restricted latency arbitrage were often willing to process profits generated from legitimate news trading. News trading was connected to real market events and could be developed into a repeatable research process. Latency arbitrage too often became a cycle of short-lived accounts and conflict.
In summer 2022, while I was still in Ukraine, I checked the news market again and was shocked by the scale of the reactions. The opportunity had not disappeared. I began rebuilding quickly despite the war, difficult family circumstances and the move to Canada with my pregnant wife.
2023–2024: rapid growth, 50 brokers and the losses that changed everything
The years 2023 and most of 2024 were my strongest period in terms of activity and development. I traded releases aggressively, increased risk and at times tested as many as 50 brokers concurrently.
That success created its own psychological risk. When a method works for a long time, it becomes easy to treat a known danger as a theoretical exception instead of a scenario that will eventually occur.
On October 3, 2024, US ISM Services was released together with other indicators in the same package. I chose to trade even though the components could conflict. They did, and the market produced a powerful reversal. I took a serious loss.
One week later, on October 10, US CPI and Initial Jobless Claims were released at the same time. Claims were affected by an unusually high number of applications following severe natural disasters in the United States, while the inflation data pointed in the opposite direction. The releases conflicted, the price action reversed, and I suffered a second major loss.
I knew both scenarios were possible. My mistake was psychological: years of favorable outcomes had encouraged the belief that things would probably work again. Two releases were enough to expose the weakness in that thinking.
What the retained orders show for October 3
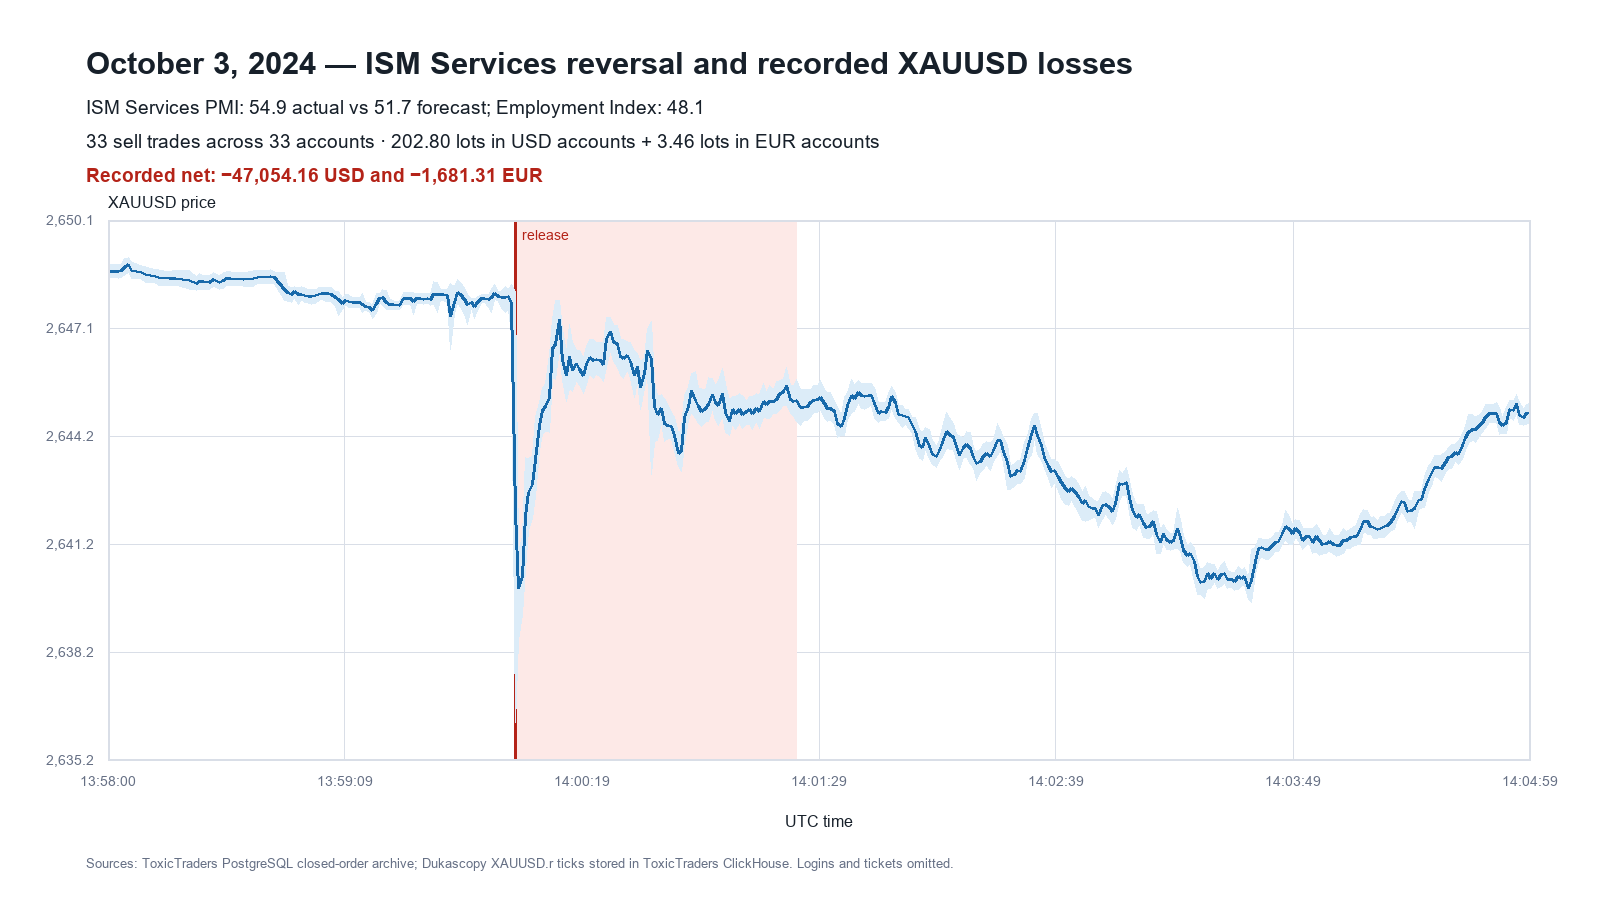
The PostgreSQL archive contains 33 XAUUSD or broker-equivalent gold sell trades opened across 33 accounts around the October 3 release. Broker order times cluster between 16:59:59.934 and 17:00:02.174, corresponding to the 14:00 UTC release after the three-hour broker-server offset observed in these records. The final recorded closes ran through 17:01:23 broker time.
Because the accounts used different deposit currencies, the results must not be combined into one unsupported total. The 30 USD-account trades recorded 202.80 lots and a net result of −47,054.16 USD after commission. Three EUR-account trades recorded 3.46 lots and a net result of −1,681.31 EUR.
The release data retained in PostgreSQL shows ISM Services PMI at 54.9 against a 51.7 forecast, while the Employment Index was 48.1. The chart uses Dukascopy XAUUSD.r ticks stored in ClickHouse and marks the recorded close window.
What the retained orders show for October 10
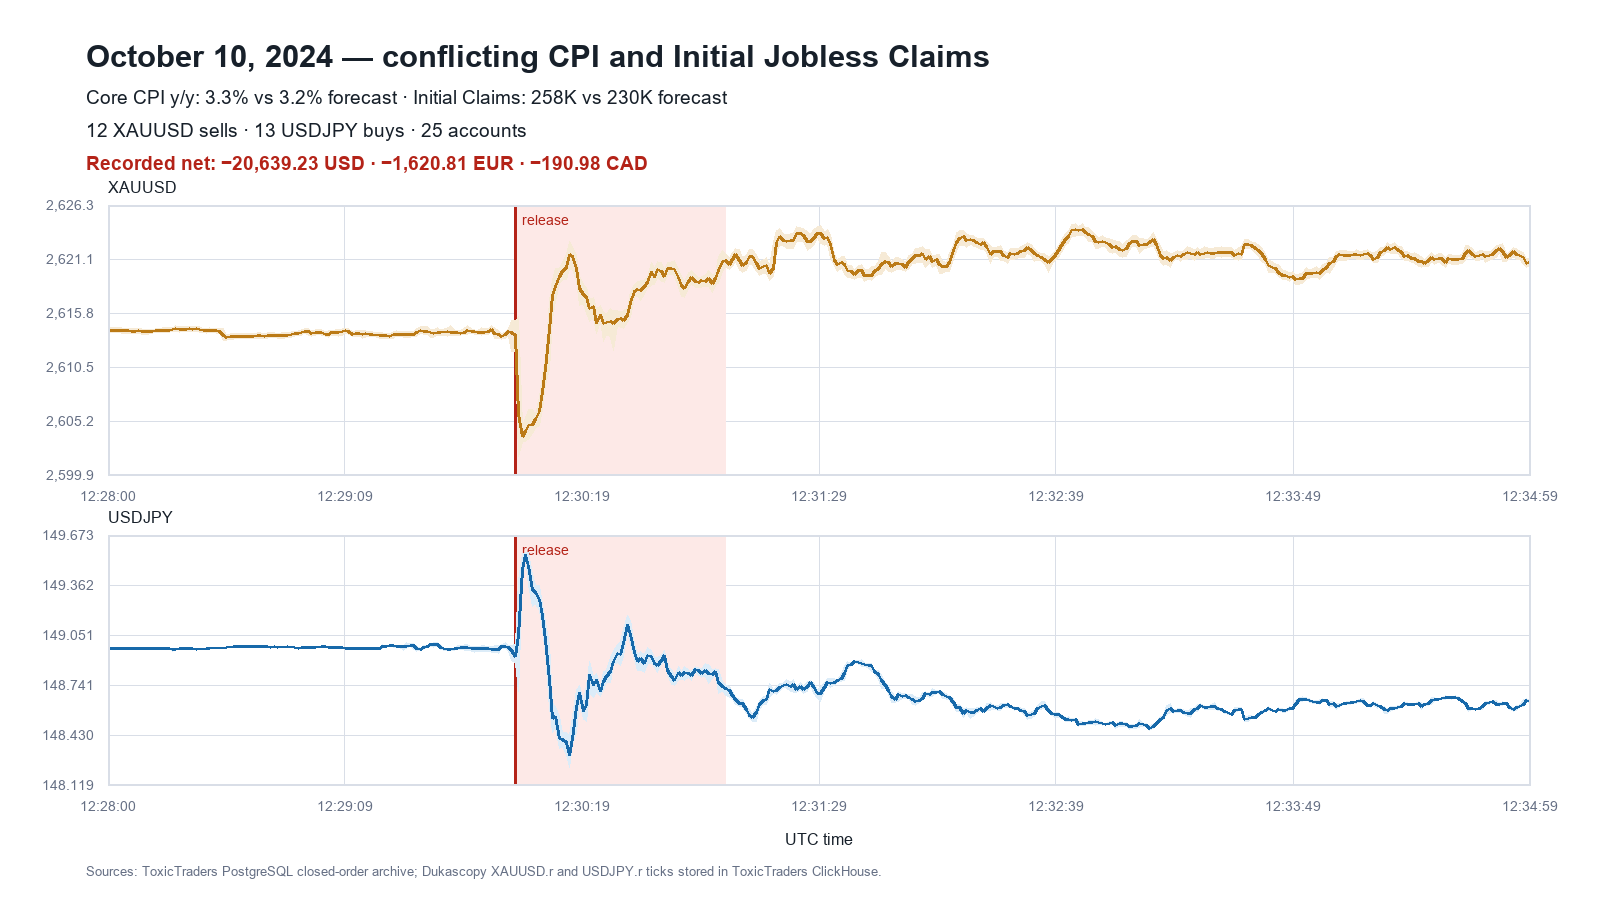
For October 10, the archive contains 25 trades across 25 accounts: 12 XAUUSD sells and 13 USDJPY buys, including broker symbol suffixes normalized into those two instrument groups. Opens ran from 15:30:01 to 15:30:08.612 broker time, corresponding to the 12:30 UTC CPI and Claims release.
The conflict is visible in the stored release values. Core CPI year over year was 3.3% against a 3.2% forecast, an inflation-positive USD signal. Initial Jobless Claims were 258K against a 230K forecast, a weaker-labour USD signal. The recorded net results were −20,639.23 USD, −1,620.81 EUR and −190.98 CAD, kept separate by account currency.
The two-panel chart uses Dukascopy XAUUSD.r and USDJPY.r ticks stored in ClickHouse. It shows the immediate two-sided reaction and the close window retained in the order archive.
October 2024 taught me the most important rules I use today:
- If several releases arrive in different seconds and I cannot control the combined risk, I skip the trade.
- Missing a profitable move is cheaper than accepting a risk I cannot define.
- Every indicator in a release package must be considered, not only the headline number.
- A rare conflict is still part of the strategy. If it is not controlled, the risk model is incomplete.
After those losses, my trading activity slowed dramatically. I redirected my effort into building ToxicTraders.
The idea behind ToxicTraders began in 2014
The first version of the idea appeared in 2014. I wanted a single source showing which brokers existed, how they differed, what regulations and platforms they used, which instruments they offered, and how spreads and execution behaved.
At the time, this information was fragmented. The economic calendars also did not give me the research environment I wanted: select a release, see its historical results, compare quotes across instruments and identify past conflicts without moving between many services.
I also wanted one trading workspace available from any device. It needed to show real-time tick and one-second charts, spreads, the signal, any opened orders, economic values, account status and financial results on one page.
There were several attempts. I began recording broker information in Excel as early as 2015. Later, I experimented with separate databases and economic calendars. The pieces existed, but they were not yet one system.
After the 2024 losses, I understood that I could not move to the next level by continuing with disconnected tools. The conflict logic, broker research, market data, execution and reporting had to exist in one place and reach a logical level of completeness.
That became the development focus of 2025 and 2026.
Returning to trading in 2026
I began returning to active trading in May 2026. The approach is more conservative and more systematic.
I now avoid releases with conflicts I cannot control. For a major event such as US Nonfarm Payrolls, where the release structure may allow a clearer risk assessment, an example of my reduced sizing is 0.5 lot of XAUUSD against a $2,000 balance. That is an illustration of my own current practice, not a recommendation for another trader.
For releases such as US ISM, where several components arrive in one package, I trade only when the conflict-prevention logic accepts the complete set of indicators. I do not want to repeat October 2024.
The goal of ToxicTraders has also changed. Commercial success matters for any sustainable project, but I am increasingly motivated by education. I want to show news trading using real quotes and repeatable reactions to similar economic deviations. I want traders to see both successful cases and the broker, execution and conflict risks that can invalidate them.
If my experience helps someone build a better process — or prevents someone from repeating one of my mistakes — that is already a meaningful achievement.
What I plan to build next
Over the next several years, I plan to complete a structured educational library for news trading. It will explain how different instruments react, how to evaluate broker and execution risk, and how to recognize conflicts within the release itself.
The initial coverage will focus on key reports from:
- the United States;
- Australia;
- Canada;
- the United Kingdom.
My main area of expertise is not claiming that every release can be predicted. It is showing how recurring economic deviations appear in real market quotes, how different brokers execute the same event, and how new indicators become relevant as the global economy changes.
News trading attracted me in 2013 because it gave market movement a visible cause. Thirteen years later, I still believe that the strategy is one of the clearest ways to study the connection between economic information, execution and price — provided that the risks are treated with the same seriousness as the signal.
Risk disclosure: This article describes personal trading experience and is provided for educational purposes only. It is not investment advice, a recommendation to use leverage, or a promise of similar results. Leveraged trading can result in the loss of all deposited funds. Broker conditions and company status can change; conduct current independent due diligence.
Forex trader since 2013, focused on macroeconomic news trading, execution quality and transparent performance reporting.